Spectroscopy in Agriculture

October 21, 2020 at 9:12 pm | Updated October 21, 2020 at 9:12 pm | 8 min read
Spectroscopy is a sensitive technology that allows precise analysis of food and is used for quality control. Infrared spectroscopy, ultraviolet-visual, Raman, nuclear magnetic resonance, and atomic emission spectroscopies are commonly used in agriculture. The incorporation of these spectroscopies into small portable devices has increased the application of these techniques. This article will briefly highlight the use of different spectroscopic instruments in agriculture.
Understanding Spectroscopy
Spectroscopy measures the absorption, transmission, and emission of electromagnetic radiation by light and other materials based on the wavelength of the radiation. The term spectroscopy also covers the interaction of electrons, protons, and ions within a compound and with those of other compounds based on collision energy.
Spectroscopy provides precise and non-destructive analysis and is widely used as an analytical tool in different sciences.
Subscribe to the Felix instruments Weekly article series.
By submitting this form, you are consenting to receive marketing emails from: . You can revoke your consent to receive emails at any time by using the SafeUnsubscribe® link, found at the bottom of every email. Emails are serviced by Constant Contact
In agriculture, spectroscopy has been used for analysis and quality control of food. As Figure 1 shows, these uses range from detecting chemical composition, microbial infection, toxins, pests, pathogens, to adulteration. Internal and external defects can also be monitored.
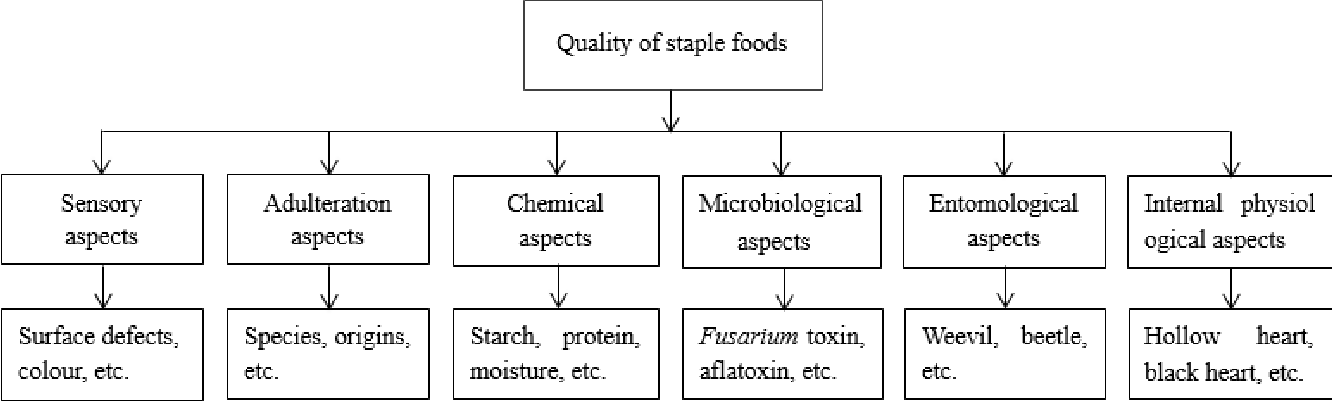
Figure 1: “Common quality evaluation of staple foods,” Su et al., 2017. (Image credits: DOI:10.1080/10408398.2015.1082966)
Optical Spectroscopy in Agriculture
Each compound or element will respond to a particular wavelength and, based on its composition, has a unique spectral signature. So, spectroscopy is used in biological sciences to determine the composition of materials and also for quantitative analysis.
The use of optical/light spectroscopy is popular in agriculture. However, agricultural technologies that use Nuclear Magnetic Resonance (NMR) and Atomic Emission Spectroscopy (AE) can also be found.
Light is a kind of electromagnetic radiation, and the different spectra are made of varying wavelengths, frequency, and energy, see Figure 2.
In spectroscopy, the spectral ranges of infrared (IR) and ultraviolet-visual have vital agricultural applications.
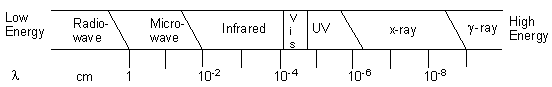
Figure 2: The electromagnetic spectrum, where λ refers to wavelength. (Image credits: http://www.chem.uiuc.edu/chem103/spectroscopy/introduction.htm)
Ultraviolet-visible (UV-VIS)
The ultraviolet-visible spectrum used for spectroscopy lies within the UV (100 nm to 380 nm) and visible (380 nm to 750 nm) range of wavelengths. In this case, it is the part of the light that is absorbed that is of interest.
UV-VIS spectroscopy is primarily used to control the quality of edible oils. There are two aspects of oil that can be tested: fat oxidation and the general color.
- Fat oxidation: The anisidine value (AV) is used as an indicator of fat oxidation. AV measures the amount of aldehyde produced during the oxidation of fats, which occurs due to exposure to light, oxygen, and high temperatures. Oxidation is not desirable as it reduces the quality of oils; therefore, oils should not have an AV of more than 8.
- Oil color: Plant pigments such as chlorophyll or carotenoids can color oil, especially if it is cold-pressed. Refined oils have very little pigment as they are removed during the refining process. Carotenoids are a group of healthy antioxidants; therefore, food producers aim to have higher levels of them in oils. Chlorophyll, on the other hand, promotes oxidation and gives oil a bitter note; it is necessary to keep chlorophyll concentrations low to meet consumer satisfaction.
Fluorescence Spectroscopy
The light that is emitted after the absorption of UV and visible light by a fluorescent molecule or fluorophore is called fluorescence.
Fluorescence spectroscopy is widely used for quantitative analysis; it is sensitive and specific enough to detect even small concentrations of compounds. Therefore, it is used to control contaminants/toxins and for structural analysis. Fluorescence can be used in combination with other techniques, such as liquid chromatography and fluorometer.
- Control of toxins: Food can contain a variety of toxins, which are produced as contaminants by pathogenic microbes (Salmonella) or fungi (mycotoxins). Toxins can also transfer into food as antibiotics (penicillin) or additives (aspartame). All mycotoxins show fluorescence.
Cereals and their processed products can be tested for toxins by fluorescence spectroscopy. - Structural analysis: Fluorescence can pinpoint small changes in structures of proteins, carbohydrates, and lipids in oils. Oils from olive, corn, soybean, sunflower, and cotton all show fluorescence. This property comes in handy to check for adulteration of oils with cheaper alternatives. For example, hazelnut oil is used as an adulterant in high-grade olive oils. Fluorescence can also be used to quantify levels of vitamin E, anisidine, and iodine in oils that are repeatedly fried.
Infrared Spectroscopy
Infrared (IR) falls within the light spectrum, stretching from 780 nm to 1 mm, and can be divided into three sub-divisions: infrared (30 µm to 1 mm), mid-infrared (5 µm to 30 µm), and near-infrared (780 nm to 5 µm).
Infrared spectroscopy is one of the most common spectroscopic methods used in agriculture. It is used in quality control for all major food groups, such as cereals, pulses, vegetables, fruits, fish, meat, dairy, and processed foods.
This wide range of food groups reacts to infrared spectroscopy, which is mostly restricted to the mid-infrared (MIR) and near-infrared (NIR) spectra.
Infrared has become a powerful technology to provide fast and non-destructive analysis in the whole supply chain, ranging from farms to retailers.
The various uses of the different sections of infrared are discussed below.
Mid-Infrared Spectroscopy
MIR detects the bonds and functional groups, as well as carbon, nitrogen, lignin. This allows for the detection of complex components. Spectroscopy uses the reflectance of mid-infrared (MIR) to study soil and food, as it provides information on structure-function relationships in quantitative analysis.
While MIR can be used alone as attenuated total reflectance (ATR), it is also often combined with the Fourier transform process (FT) and used as the diffuse reflectance infrared Fourier transform (DRIFT) process.
The main uses of MIR include studying soil and organic matter and detecting fungus contamination in food.
- Soil study: The leading uses of MIR are the determination of soil composition and its properties, and organic matter. DRFIT is used to find out the chemical composition of soil and humus. ATR is used to examine soil organic matter. Different wavelengths of MIR are necessary to detect primary components such as feldspars and quartz, the secondary ingredients like silicates and clay, and minerals usually found in the soil like carbonates, calcites, etc. Similarly, organic matter components such as lignin, carbohydrates, cellulose, fats, and proteinaceous material also respond to different peaks of MIR.
- Humic substances: Natural organic compounds that originate from plants, animals, or chemicals are found in soils, rivers, and in brown coals. The exact composition of humic substances can be detected by DRIFT.
- Quality control: MIR is used to identify fungal disease and estimate levels of mycotoxins in cereals during the farming, processing, and storing stages.
Near-Infrared Spectroscopy
Near-infrared is undoubtedly the most widely used technique in spectroscopic applications for agriculture and is applied for quantitative analysis.
There are many categories of NIR spectroscopy use in agriculture:
- Maturity: Dry matter levels are used to determine if fruits and vegetables are mature enough for harvest in climacteric fruits. Mature fruits are still green; dry matter estimation is necessary to ensure they are not harvested too early, as that would prevent proper ripening. Collecting them later would cut short transport and storage time.
- Processing: Determination of parameters—such as dry matter, BRIX, and water content—are essential in the processing centers. NIR can be used to detect them, help to select the right fresh produce, and monitor the whole process. Cereals, fruits, vegetables, mushrooms, etc. can be tested this way.
- Pest, Disease, and Toxin Detection: NIR is used to identify fungal contamination and estimate levels of mycotoxins in the whole supply chain, for cereals and grains.
- Drought management: Since water has a unique spectral signature, its levels are monitored to check if crops are suffering from water stress and manage irrigation accordingly.
- Fertilizer application: Plant growth can be tracked by leaf spectrometry. Farmers and scientists can track crop progress and respond with optimal nutrient applications for the crops.
- Post-harvest quality control: Many climacteric fruits spend months in the supply chain after harvest, in storage, transport, and in retail shops. Different quality parameters, including ripeness, internal damage, and external appearance, can be monitored to cull spoiled produce and save the rest of the products from ethylene effects.
Felix Instruments have developed many tools with NIR spectroscopy, including leaf spectrometers and quality meters.
- Leaf spectrometers: The CI-710 Miniature Leaf Spectrometer detects stress due to drought, pest, pathogens, and nutrient deficiency.
- Quality meters: There are three devices to measure DM: total soluble solids (TSS), titratable acidity, and external and internal color of fruits.
- The one that can be used for many fruits and vegetables is the F-750 Produce Quality Meter
- Popular varieties of mango can be tested by the F-751 Mango Quality Meter
- Maturity is measured in avocados indirectly by dry matter, as it is correlated to oil content, by the F-751 Avocado Quality Meter.
Raman Spectroscopy
Raman spectroscopy is described as vibrational spectroscopy. It depends on the Raman effect where incoming photons (basic units of light) interact with electrons in a compound. The photons can either lose or gain energy, depending on the levels of vibrational energy in the atoms of the compounds. The Raman effect is the difference in the pre- and post-interaction energy levels of photons. Raman spectroscopy provides narrow and specific bands as information.
However, the Raman effect is weak because it needs high concentrations of samples and is more difficult to measure.
- Research: Raman spectroscopy is considered a valuable tool for studies at the molecular level, in fundamental and applied agricultural research
- Food quality and safety control: Raman spectroscopy can detect many definitive functional groups in compounds that make up food, so it is used to analyze the chemical composition of food ingredients and products. It is also used to find adulterants of oils.
Other Spectroscopic Methods
Other spectroscopy used in agriculture is nuclear magnetic resonance (NMR) spectroscopy and atomic emission spectroscopy. These two techniques, however, require extensive instrumentation.
- NMR spectroscopy: This technique depends on spectral information obtained by the interaction of the magnetic properties of the atoms in a compound with those of the applied field of magnetic force.
It is used to test soil components, plant tissues, and food products. For example, it can be used to determine the genotype of the grapes used in wine-making, their place of origin, and the soil properties of the vineyard it was grown in. As a food quality control measure, it can be used to monitor ripening, drying, and adulteration.
- Atomic Emission (AE) spectroscopy: AE is used in the qualitative and quantitative detection of chemicals, usually elements. Light from plasma or flame is directed at a sample to excite the atoms that make it up. As a result, the atoms produce photons or light at wavelengths specific to them. The amount of each wavelength quantifies the element.
In combination with inductively coupled plasma, atomic emission spectroscopy is used to determine the presence of trace elements in herbal medicinal preparations, such as traditional Chinese medicines, or it can be used to detect the presence of metals and arsenic in food or wine.
Replacing Old Technology
Conventional methods of food analysis are destructive, time-consuming, complicated, and need infrastructure and resources. Spectroscopy allows quick and precise measurements with little or no sample preparation. As of late, this technology is being incorporated in small handheld tools to help to bring these sensitive yet powerful techniques within reach of not only scientists but also farmers and other food producers.
—
Vijayalaxmi Kinhal
Science Writer, CID Bio-Science
Ph.D. Ecology and Environmental Science, B.Sc Agriculture
Sources
Capitani, D., Sobolev, A. P., Tullio, V. D., Mannina, L., & Proietti, N. ( 2017, July 17). Magnetic Resonance in Agriculture. Retrieved from https://www.springeropen.com/collections/MR-in-agriculture
Chemistry Learner. Atomic Emission Spectroscopy. Retrieved from https://www.chemistrylearner.com/atomic-emission-spectroscopy.html
Chen, H., Liang, P., Hu, B., Zhao, L., Sun, D.H., & Wang, X.R. (2002). The application of inductively coupled plasma atomic emission spectrometry/mass spectrometry in the trace elements and speciation analysis of traditional Chinese Medicine.
Crocombe, R.A. (2018). Portable Spectroscopy. Applied Spectroscopy.72: 1701-1751. DOI:https://doi.org/10.1177%2F0003702818809719.
García-Sánchez, F., Galvez-Sola, L., Martínez-Nicolás, J.J., Muelas-Domingo, R., & Nieves, M. (2017). Using Near-Infrared Spectroscopy in Agricultural Systems. Developments in Near-Infrared Spectroscopy. Editors: Kyprianidis, K., & Skvaril, J. Tech Open. DOI: 10.5772/67236
Hossain, M.Z., & Goto, T. (2013). Near- and mid-infrared spectroscopy as efficient tools for detection of fungal and mycotoxin contamination in agricultural commodities. World Mycotoxin Journal, 7. DOI: https://doi.org/10.3920/WMJ2013.1679
Li, Q., Chen, J., Huyan, Z., Kou, Y., Xu, L., Yu, X., & Gao, J.M. (2018) Application of Fourier transform infrared spectroscopy for the quality and safety analysis of fats and oils: A review, Critical Reviews in Food Science and Nutrition, DOI: 10.1080/10408398.2018.1500441
Nawrocka, a., Lamorska, J. (2013). Determination of Food Quality by Using Spectroscopic Methods. Advances in Agrophysical Research. DOI: 10.5772/52722
Perera, C.O. (2009) A Review of:“Infrared Spectroscopy for Food Quality Analysis and Control, edited by Da-Wen Sun,” Drying Technology, 27:10, 1166-1167, DOI: 10.1080/07373930903221911
Su, W.H., He, H.J., & Sun, D.W. (2017) Non-Destructive and rapid evaluation of staple foods quality by using spectroscopic techniques: A review, Critical Reviews in Food Science and Nutrition, 57:5, 1039-1051, DOI: 10.1080/10408398.2015.1082966
Stoner, J.O., Hurst, G. S., Graybeal, J.D., & Chu, S. Spectroscopy. Britannica. Retrieved from https://www.britannica.com/science/spectroscopy
Tinti, a., Tugnoli, V., Bonora, S., & Francioso, O. (2015).Recent applications of vibrational mid-Infrared (IR) spectroscopy for studying soil components: a review. Journal of Central European Agriculture, 16:1-22. DOI: 10.5513/JCEA01/16.1.1535
Whiting, D. (2017, April 24). What is a Spectrometer? Sciencing. Retrieved from https://sciencing.com/spectrometer-5372347.html
Yeong, T. J., Pin Jern, K., Yao, L. K., Hannan, M. A., & Hoon, S. (2019). Applications of Photonics in Agriculture Sector: A Review. Molecules (Basel, Switzerland), 24, 2025. DOI:10.3390/molecules24102025
Related Products
- F-901 AccuRipe & AccuStore
- F-751 Melon Quality Meter
- F-751 Kiwifruit Quality Meter
- F-750 Produce Quality Meter
- F-751 Avocado Quality Meter
- F-751 Mango Quality Meter
- F-900 Portable Ethylene Analyzer
- F-950 Three Gas Analyzer
- F-920 Check It! Gas Analyzer
- F-960 Ripen It! Gas Analyzer
- F-940 Store It! Gas Analyzer
Most Popular Articles
- Spectrophotometry in 2023
- The Importance of Food Quality Testing
- NIR Applications in Agriculture – Everything…
- The 5 Most Important Parameters in Produce Quality Control
- Liquid Spectrophotometry & Food Industry Applications
- Ethylene (C2H4) – Ripening, Crops & Agriculture
- Melon Fruit: Quality, Production & Physiology
- Active Packaging: What it is and why it’s important
- Guide to Fresh Fruit Quality Control
- Understanding Chemometrics for NIR Spectroscopy


