NIR Applications in Agriculture – Everything You Need to Know for 2023
Dr. Vijayalaxmi Kinhal
September 6, 2022 at 6:48 pm | Updated September 7, 2022 at 11:07 pm | 16 min read
A Guide to NIR Applications in Agriculture for 2023
Explore the “what,” “why,” and “how” of NIR spectroscopy in agriculture. From quality control to sustainable farming, breeding programs to disease detection, dive into all your questions about NIR as we look toward 2023 and beyond.
Subscribe to receive our monthly round-up of articles.
- Near-infrared (NIR) spectroscopy using data collected by scanners and imaging provides non-destructive and accurate sensory and internal quality parameters analysis.
- The real-time analysis onsite enabled by newer scanner-based portable devices has brought about a paradigm shift in quality control in the entire food supply chain. It has the potential to make food production sustainable.
- NIR scanner applications are becoming increasingly common in the field for estimating maturity, quality, sorting, grading, monitoring, retailing, and research.
- NIR imaging applications are more prevalent at large and local scales; however, onsite spot imaging measurements are gaining traction.
Near-infrared (NIR) testing is a standard technology for evaluating food and agriculture products. NIR applications are rising as demand for non-destructive, accurate, and rapid food quality and safety analysis is increasing. Consequently, NIR technology is continuously being upgraded to improve performance and make it more affordable for scientists and all stakeholders in the food supply chain. This article will provide a framework for understanding NIR and its use in different agriculture areas.
Improving Application of NIR Technology
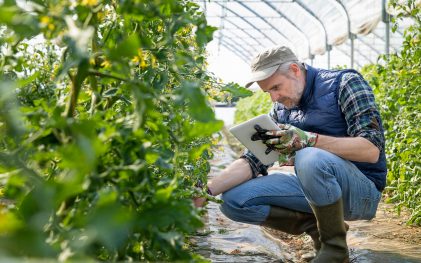
Farmers need non-destructive, accurate, rapid, and user-friendly tools to use on the farm to give them detailed information on the physical and chemical properties of crops at every stage of their growth. They also need to monitor the maturity and quality of their products. Of course, quality control continues beyond the farm and is necessary throughout the supply chain and retail sector.
Near-infrared technology, which has been used for the last four decades, provides vital agricultural solutions. Earlier, NIR technology consisted of mostly benchtop devices for at-line qualitative and quantitative analysis of samples. Analysis suffered from the high moisture content and physical and chemical heterogeneity of samples. Moreover, seasonal and regional variations reduced the objectivity of results.
Spectroscopic research is progressing rapidly as stakeholders in the food industry realize the benefits it brings to their value chain. NIR technology can add value to any agricultural business in terms of production on the farm, processing, logistics, service, and marketing, giving them a competitive advantage.
Significant progress in NIR spectroscopic research in spectral scanners and imagery is now combined with state-of-art chemometrics. Analytical models like artificial neural networks allow scientists to incorporate more parameters and differences arising from agricultural practices, climate, season, and cultivars. Many manufacturers, like Felix Instruments Applied Food Science, provide guidance for model building so scientists can customize existing models for other fruits and varieties. As a result, NIR technology is now simpler to use, more precise, and provides analysis in real-time.
Grafting techniques for transferring chemometric models have also improved, making it possible to develop tools suitable for various pockets. Simultaneously, there has been miniaturization of technology, creating small portable devices more convenient to handle in the field, farm, greenhouses, or laboratory.
Easy access to NIR precision tools has also enabled an expansion in applications. Scientists are continuously finding new applications for the technology. Recently, there has been an explosion of NIR applications in every facet of food production- grains, vegetables, fruits, animal rearing, and meat production.
The Infrared Spectrum
The versatile NIR is part of the infrared spectrum of solar radiation. The infrared range lies beyond 760 nm, and the near-infrared section falls between 760–1400 nm. Solar radiation has three prominent bands (See Figure 1), and light reaching the earth consists mainly of infrared (50%), followed by visible light (42%), and ultraviolet (8%) rays. Unlike the visual spectrum, we can’t see infrared waves but detect them as heat.
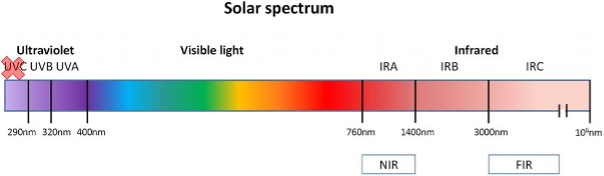
Fig. 1. Solar spectrum composition with its parts, Barolet et al. 2016. (Image credits: https://doi.org/10.1016/j.jphotobiol.2015.12.014)
When solar radiation passes through the atmosphere, air and pollutants scatter visible light, but the infrared spectrum can pass through it. Remote sensing photographs of the earth’s surface from satellites make use of this property. All objects and living matter emit radiation in the infrared spectrum as heat. Infrared is also the light range emitted most- because of its longer wavelength.
Relevance of IR and NIR in Agriculture
Infrared radiation is absorbed, transmitted, and emitted by compounds, depending on the vibrations of the chemical bonding between component atoms or molecules. The vibrations’ frequencies determine the parts of the infrared spectrum that they absorb, transmit, or reflect. Thus, each molecule or compound has its unique fingerprint or spectral signature.
Based on the spectral signature, it is possible to know the size, shape of atoms and molecules, and the bonds holding them together. The information on the structure of the compounds helps to identify the makeup of compounds or plants. Depending on the interaction with light, it is also possible to determine the amount of these compounds. Therefore, infrared light is valuable in studying the different compounds and their concentrations.
Moreover, plants do not use the infrared spectrum in photosynthesis or any other plant function, so there is no “interference” in producing spectral signatures.
How does NIR Work?
Near-infrared (NIR) is the light band most suitable for detecting organic compounds because bonds between carbon and hydrogen (C-H), oxygen and hydrogen (O-H), and nitrogen and hydrogen (N-H) absorb wavelengths that fall in the NIR spectrum. Since organic compounds are the major components found in the living tissue of plants and animals, NIR is suitable for use in agriculture.
Moreover, near-infrared can penetrate deeper into a sample than any other part of the infrared spectrum. NIR is the part of the IR spectrum that can identify components in a sample, whereas the mid-infrared range provides information on the structure-function relationships of compounds.
NIR Spectroscopy Scanner Measurements
NIR spectroscopy is incorporated in many hand-held tools and benchtop devices to provide a wide range of applications, which are increasing with time. These tools can be used at-line, online, or inline, making spectroscopy tools versatile.
NIR spectroscopy was developed primarily as a tool for field quality control. NIR testing is used for the qualitative and quantitative analysis of agricultural products’ moisture, protein, fat, starch, sugar, fiber, and ash.
The scanner-based tool directs a ray of NIR light of a specified spectrum towards the object. The absorbed, reflected, and transmitted light spectrum will differ depending on the compounds and their concentrations. The scanners in the tools record these spectra. In the case of spectrometers, the spectral signature is used in a wide range of pre-programmed vegetation indices. Most indices use reflectance data, but some will also use absorbance data. Some examples of these include Normalized Difference Vegetation Index (NDVI), Water Band Index (WBI), Plant Senescence Reflectance Index (PRSI), etc.
The measurements are non-destructive and quick, and the tools can be used in the field, aslaboratories, and classrooms.
NIR Spectroscopy Imaging
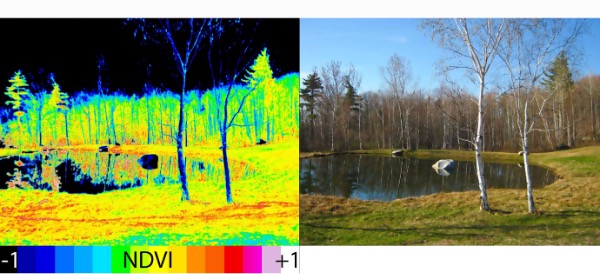
Figure 2: “Normal color photo (right) and normalized difference vegetation index (NDVI) image (left). NDVI image was derived from two color channels in a single photo taken with a camera modified with a special infrared filter. Note that tree trunks, brown grass, and rocks have very low NDVI values because they are not photosynthetic. Healthy plants typically have NDVI values between 0.1 and 0.9.” (Image credits: @cfastie, https://publiclab.org/wiki/ndvi)
NIR spectroscopy imaging involves taking images of pixels in contiguous spectral bands so that a radiance spectrum of a pixel is acquired, identifying the surface materials.
The imagery can provide information on the stress that plants are suffering. Spectral images also reflect changes in leaf composition due to pest and disease attacks. The chlorophyll content in leaves can indirectly measure nutritional deficiency in plants. Recognition of species is also easy through NIR imagery. NIR imagery is more commonly used for large-scale surveys than field measurements.
- Large-scale NIR Imagery: NIR imagery is well established in producing satellite imagery through remote sensing. Satellite imagery is more suitable for research and larger organizations, like government departments, for research and policy development. Though consultants can transfer information to farmers, there will always be a time lag.
- Field-scale: With the advent of precision farming, there has been an interest in small-scale applications of NIR imagery acquired through drones.
- Spot NIR Imagery: NIR cameras can be used much like regular cameras; the only difference is that the imagery is in the NIR, not the visible spectrum. These NIR images can highlight areas with high photosynthesis, unhealthy plants, or unsuitable growing conditions (See Figure 2).
The ability of NIR to determine the physical and chemical properties of substances is applied through scanner measurements and imaging at various stages in agriculture and is discussed below.
Measurement of Nutritional Status of Crops
NIR scanners are adept at measuring various aspects of plant physiology that reflect the nutritional status of crops.
NIR tools provide information on the concentrations, deficiency or excess, of the major nutrients such as nitrogen, phosphorus, and potassium, by detecting chemical composition in leaves. NIR testing can replace cumbersome, long, and complicated analysis in the laboratory. For example, it is often used instead of the comparatively cumbersome Kjeldahl Method to quantify nitrogen in plants. Farmers and agronomists can detect nitrogen deficiency in plants using NIR spectroscopy photosynthesis analysis.
Similarly, NIR technology can detect iron, magnesium, and zinc in leaves of cereal and other crops. The nutritional status of leaves has been determined successfully for apple, citrus, alfalfa, sugarcane, and root crops.
If the analysis shows a deficiency of any element, a farmer can provide timely nutritional supplements in the amounts required. As a result, they can also avoid over-use of fertilizers, the resulting toxicity in plants, and reduce expenses.
CID Bio-Science produces NIR tools for this purpose, such as the CI-710s SpectraVue Leaf Spectrometer, which measures chlorophyll levels in leaves, photosynthetic rates, nutritional status of food, and stress impacts, among many other metrics.
Determining Harvest Time
One of the most widespread uses of NIR scanner-based devices is measuring dry matter to fix optimum harvest time and monitor the quality of grains, pulses, fruits, and vegetables.
Dry matter (DM) is the total of all solids in a plant minus its water content. DM has been established as one of the most critical parameters in crop production. Non-destructive measurements are necessary since agricultural products are tested several times to determine if they are ready for harvest. Small, cost-effective devices, which give rapid, easy-to-understand results, can sample even large crop areas within a day.
Felix Instruments – Applied Food Science produces five quality meters based on NIR spectroscopy, which measure DM, soluble solids content (SSC), titratable acidity, and external and internal color of fruits.
- The F-750 Produce Quality Meter is an open-ended research tool suitable for many fruits and vegetables.
- The F-751 Avocado Quality Meter measures dry matter as an indicator of oil content to determine the maturity of avocados.
- The F-751 Mango Quality Meter measures dry matter and ºBrix and is calibrated for the popular mango varieties.
- The F-751 Melon Quality Meter measures ºBrix in melon varieties like Cantaloupe and Honeydew.
- The F-751 Kiwifruit Quality Meter estimates DM and ºBrix in kiwi cultivars such as Hayward and Gold3.
Additionally, NIR imaging by hyperspectral devices is often harnessed for quality control in berries such as strawberries and grapes. Together with advanced chemometrics, they identify the maturity of non-climacteric fruits by quantifying SSC.
NIR for Fruit Processing
Spectroscopic measurements have a wide range of uses during food processing. The use of NIR tools begins on the farm.
Farmers growing fruits meant for processing to make juices, wines, and other liquids, place a premium on sugar content. Fruits have to be harvested at the correct time to achieve the right sugar content. Maturity and ripening are followed meticulously in the field to fix the optimum harvest time. The DM content is used to select the harvest date among climacteric fruits, such as apple or mango. In non-climacteric fruits, like berries and grapes that do not ripen much after harvest, the SSC of crops is monitored to fix harvest time. In the case of blackberries, both sugar content and acidity are checked.
There are various NIR applications for sorting and processing fruits and vegetables:
- Sugar content is also monitored post-harvest to use fruits at a similar stage of ripeness for processing.
- Water content is measured for several products meant for fresh consumption, such as mushrooms, vegetables, mango, banana, and strawberry.
- During the production of sultanas, which are produced by drying grapes, the moisture content is monitored in the field to fix drying time and in dry centers.
- NIR spectroscopy is used to establish the nutritional status of fruit juices, for example, bioactive compounds in pomegranate juice.
In all these cases, non-destructive NIR tools that give instant readings are assets that assist decision-making in real-time. The F-750 Produce Quality Meter has successfully tested various fruits’ dry matter, SSC, acidity, color, and moisture content.
NIR for Grain Composition
The composition of grains, i.e., proportions of different compounds such as proteins, starch, or fat, can differ across species, varieties, and even individual plants; therefore, they are tested at harvest or post-harvest.
Crops are tested during harvest to sort or ensure they meet the required parameters.
NIR spectroscopy has been used in combination with harvesters to screen large areas of crops to sort grains according to protein content at harvest time. Wheat with higher protein content fetches premium prices. Therefore, protein content in wheat is checked to sort them into different grades, either during harvest or handling.
Analysis of oil and protein content of single seeds in sunflower, rapeseed, cotton, and soya beans is also done with the help of NIR spectroscopy. NIR spectroscopy also determines the levels of amino acid nitrogen in tuber mustards.
The CI-710s SpectraVue Leaf Spectrometer from CID Bio-Science can be used for testing seed crop quality.
NIR for Detecting Diseases, Pests, and Toxins
NIR spectroscopy can be used to detect diseases before visual symptoms appear in growing crops as well as in stored grains. Stress produced due to pests, diseases, and weeds will change plant composition and can also be detected by NIR spectroscopy. Remotely sensed images use this principle in precision agriculture to grade fields based on infection intensity and extent so that growers can make data-driven treatment decisions.
Fusarium (Fusarium asiaticum and Fusarium graminearum) is a common fungal disease that afflicts barley plants, affecting the end quality of the grains and decreasing yield.
Rice blast caused by Magnaporthe oryzae reduces yield and is a health hazard for people.
Both these fungi have been successfully detected using NIR field tools and thus provide a timely and efficient means of controlling infection to limit the damage.
During post-harvest storage, rice is particularly susceptible to fungal infections. NIR technology has been used to find and quantify fungal infections of Aspergillus producing aflatoxins in rice grain. The fungal infection is identified by detecting the presence of aflatoxin B 1 using wavelengths of 950 and 1650 nm.
NIR technology can also detect insect infestation and cereals’ damage post-harvest.
Internal compound examination by NIR tools can detect the development of toxins in seeds. For example, amino acid L-canavanine is a toxic compound that can develop in grains and reduce food intake in non-ruminants.
The CI-710s SpectraVue Leaf Spectrometer from CID-Science is used to detect plant stress.
NIR for Monitoring Drought
Water has its own unique spectral signature that NIR can detect. Measuring leaf water content lets farmers and agronomists know if the plants are suffering from water stress. They can then use this information to regulate irrigation schedules.
The CI-710s SpectraVue Leaf Spectrometer from CID-Science is an example of a leaf probe widely used for detecting water stress in plants and soil.
NIR imaging is also suitable for measuring plant water content based on water’s spectral signature at all scales.
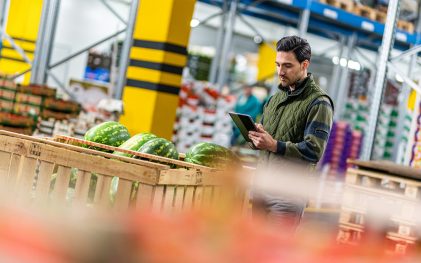
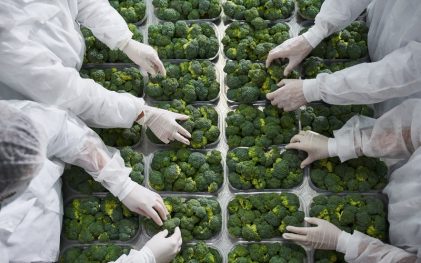
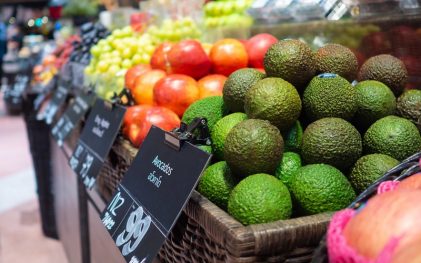
NIR for Quality Control
NIR scanners for sorting, grading, and monitoring the quality of fresh produce and processed products during storage, transport, and retail are a significant application of this technology. The Felix Instruments range of NIR-based quality assessment devices is designed specifically for these tasks.
Appearance, color, and texture are essential to ensure consumer satisfaction. Also, NIR testing of DM and SSC levels at harvest allows growers to produce fruits that meet consumer tastes. With quality meters, retailers can judge when the fruits are ripe enough to move goods from storage to shops.
Early detection of over-ripe produce with NIR imaging, before the appearance of visual symptoms, can help in culling spoiled products to prevent ethylene from spreading and causing early ripening of other nearby produce. Or ready commercial NIR cameras for spot measurements can also be used to inspect the quality of fruits at purchase. The NIR images clearly show bruises long before they are visible to human eyes.
Scientists are trying to establish NIR hyperspectral imaging for quality control of walnuts by checking for total fat, monosaturated, saturated, and polyunsaturated fatty acids.
NIR scanners are also used in quality control of wide-ranging products such as honey, oils, or olives to ensure good purchases and advise buying choices. By detecting the hydrophilic phenols produced only by olives, NIR testing determines the authenticity of olive oil and checks that it is not adulterated. Similarly, adulteration of green banana flour can be spotted by NIR spectroscopy, improving export and income generation possibilities.
The F-750 Produce Quality Meter from Felix Instruments can measure the internal color and firmness of fruits and internal decay in fruits and vegetables. It can also be used to check liquids, like juices or wine, and test hydrophilic phenols in olive oils.
With NIR tools, quality control between the farm and shop is easy and can be performed often, as the method is quick and non-destructive. NIR testing is considered crucial in reducing food loss and ensuring food sufficiency.
NIR for Animal and Dairy Products’ Quality Control
NIR spectroscopy is suitable not only for plants but also for animal products. Quality control in animal products is based on determining body composition. In the absence of specific tools for a meat product, scientists sometimes use available NIR scanners; for example, some researchers used the F-750 Produce Quality Meter to test fish quality successfully.
For aquatic animals, like fish and shellfish, parameters tested by spectroscopy are protein, fat, water, minerals, vitamins, carbohydrates, and extractives.
In the case of beef, pork, and poultry, parameters like fat, protein, and water content can differentiate between species or cuts of meat. These have applications in determining adulteration and place of origin.
NIR scanning is a standard procedure to evaluate and monitor the production and quality of cheese. Different cheeses are defined by varying fat and water composition, which are used to set quality benchmarks. NIR testing is handy for growers and government officials to check if the cheese meets required national and international standards for marketing.
NIR scanning and imaging are also used in rearing animals. The post-harvest quality of many types of forage is ascertained based on the dry matter content. For example, the nutritional quality of potatoes is used to calculate the amounts of feed given to animals to ensure they have an optimum diet. Starch, sugars, and DM are measured in maize meant for the silos to ensure silage quality. Or farmers measure milk quality to determine the feed composition for their cattle.
NIR imaging is used to check for residual feed to estimate the quantity of feed consumed by poultry.
NIR for Sustainable Precision Agriculture
Precision agriculture utilizes imaging at large, field scales, and spot measurements.
Satellites and drones with imaging cameras acquire remotely sensed multispectral and hyperspectral images to provide visual and spatial information about crops. NIR images show small-scale differences in soil conditions, crop health, and performance of an entire field. Using this information, farmers can identify soil type, structure, water status, and fertility. It is still an airborne application, even at field level, and needs additional equipment such as a drone.
A new study has established that NIR scanners, such as Felix quality meters, can be used to check the nitrogen content in solid and liquid manure to determine the quantity a farmer has to apply. In organic agriculture, farmers rely on compost made from agricultural wastes, such as straw, corn, and chicken or cow manure, to provide nutrients to enhance soil fertility. This new study will allow farmers to rapidly measure the chemical composition of compost with simple sampling, avoiding long waits for results from a laboratory.
Tools like CI-710s SpectraVue Leaf Spectrometer can also measure the nutritional and water content of leaves and provide information on the nutrient or irrigation needs of the crops.
Using portable tools, farmers can decide the correct amounts of nutrients to apply to maintain soil fertility but avoid creating pollution through excessive use. Hence NIR technology can make farming sustainable too.
NIR for Agricultural Soil Testing
Soils contain minerals, water, air, organic matter, and microbes. It is challenging to separate organic matter, of which there is usually only 1-5% present in the soil, from the mineral content. Moreover, conventional estimation methods of organic matter are long drawn and involve many elaborate steps. NIR measurements are quick and can be taken on the farm or laboratory without sample preparations.
NIR spectroscopy has also been used to test other aspects of soil pertaining to crops. Mineral composition of soils, such as nitrogen (N), phosphorus (P), potassium (K), iron (Fe), calcium (Ca), and magnesium (Mg), can be quantified to ascertain their availability for plants in fertilizer management.
Water dynamics in soil, determined by soil texture, is another crucial parameter NIR can measure to advise irrigation management. However, it does require calibration for different localities.
NIR & Renewable Energy Production
NIR spectroscopy is used in bioethanol production at various stages, from the farm to the processors.
Raw materials that contain starch, cellulose, and sugars are fermented to produce bioethanol. These feedstocks could be grains—such as wheat, corn, sorghum, and barley—sugar cane, beet, grass, crop, and forest residues.
Feedstock’s starch or sugar content must be estimated before processing to know the possible ethanol yield.
If grains and residues are used, they are first crushed and treated with enzymes to convert the starch to sugars. Yeasts then ferment the sugar to produce alcohol. Detailed chemical analyses of various components in the fermentation media, such as glucose, maltose, fructose, arabinose, lactic acid, and acetic acid, are tested to monitor the fermentation process.
NIR spectroscopy tools provide information on ºBrix or TSS content, starch, and lignocellulose of feedstocks at harvest. During the production process, testing is also used to monitor the fermentation parameters.
NIR in Breeding Programs
Scientists and agronomists use many instruments that utilize NIR spectroscopy, especially in breeding programs and to suggest agricultural practices, due to its precision.
Figure 3: NIR imaging used to study drought tolerance in wheat, Danzi et al., 2022. (Image credits: https://doi.org/10.3390/agriculture12040537)
A lot of research in crop breeding is focused on finding drought tolerant cultivars to deal with extended dry spells by climate change. NIR imaging of plant water content allows scientists to quickly identify varieties that can tolerate drought, see Figure 3.
Fertilizer and irrigation applications for each variety are checked and fixed depending on plant health and response, which are monitored with spectroscopy. The CI-710s SpectraVue Leaf Spectrometer can be instrumental in matching species and varieties to different water and nutrition supply regimes in cereals, vegetables, and fruits.
NIR tools help determine the best varieties and crops for bioethanol production by measuring their sugar, starch, cellulose, or lignin content. Similarly, NIR devices like Felix quality meters are used to establish the best agricultural practices to improve fruit and vegetable quality, fruit coatings, and packaging innovations.
NIR Applications
NIR is a technology seemingly tailor-made for agriculture, not only for research but also for growers, packers, and distributors. Today’s devices are sophisticated and give rapid measurements that are easy to understand and use in real-time. They are precise enough for use in research and complement existing equipment, taking the guesswork out of farm management, while becoming ever-more user friendly. NIR scanners are more widespread and developed for spot measurements, with imaging applications gradually gaining popularity. Smaller and portable tools are more affordable than ever and will continue to be an essential step in bringing quantifiable scientific value to the food supply chain, saving stakeholders time, money, and resources.
—
Vijayalaxmi Kinhal
Science Writer, CID Bio-Science
Ph.D. Ecology and Environmental Science, B.Sc Agriculture
Source
Daniel Cozzolino, D., Porker, K., & Laws, M. (2015). An Overview on the Use of Infrared Sensors for in Field, Proximal and at Harvest Monitoring of Cereal Crops. Agriculture, 5:713-722; doi:10.3390/agriculture5030713
Danzi, D., De Paola, D., Petrozza, A., Summerer, S., Cellini, F., Pignone, D., Janni, M. (2022). The Use of Near-Infrared Imaging (NIR) as a Fast Non-Destructive Screening Tool to Identify Drought-Tolerant Wheat Genotypes. Agriculture, 12, 537. https://doi.org/10.3390/agriculture12040537
Devianti, D., Sufardi, S., Mustaqimah, M., & Munawar, A. A. (2022). Near Infrared Technology in agricultural sustainability: Rapid prediction of nitrogen content from organic fertilizer. Transdisciplinary Journal of Engineering & Science, 13. https://doi.org/10.22545/2022/00167
Editors of Encyclopaedia Britannica. (2018, Okt. 05). Infrared radiation. Retrieved from https://www.britannica.com/science/infrared-radiation
Energy from the sun to earth’s surface. Retrieved from http://www.ccpo.odu.edu/SEES/veget/class/Chap_2/2_1.htm
Hernández-Hierro, J. M., Cozzolino, D., Feng, C.-H., Rato, A. E., & Nogales-Bueno, J. (2022). Editorial: Recent advances of near infrared applications in fruits and byproducts. Frontiers in Plant Science, 13. https://doi.org/10.3389/fpls.2022.858040
García-Sánchez, F., Galvez-Sola, L., Martínez-Nicolás, J.J., Muelas-Domingo, R., & Nieves, M. (2017). Using Near-Infrared Spectroscopy in Agricultural Systems. Developments in Near-Infrared Spectroscopy. Editors: Kyprianidis, K., & Skvaril, J. Tech Open. DOI: 10.5772/67236
Kochevar, I.E., Pathak, M.A. & PJ, A. (1999). Photophysics, photochemistry, and phobiology Fitzpatrick (Ed.), Dermatology in General Medicine, McGraw-Hill, NewYork.
Lim, Jong Guk, et al. (2017). Rapid and non-destructive discrimination of Fusarium Asiaticum and Fusarium Graminearum in hulled barley (Hordeum vulgare L.) using near-infrared spectroscopy. Journal of Biosystems Engineering 42 (4): 301-313.
Long, D.S., Engel, R.E., & Siemens, M.C. (2008). Measuring grain protein concentration with in line near infrared reflectance spectroscopy. Agron. J., 100, 247–252.
Nascimento, R. J. A., Macedo, G. R., Santos, E. S., & Jackson, J. A. (2017). Real time and in situ Near-Infrared Spectroscopy (Nirs) for Quantitative Monitoring of Biomass, Glucose, Ethanol and Glycerine concentrations in an alcoholic fermentation. Brazilian Journal of Chemical Engineering, 34.:459-468. DOI: 10.1590/0104-6632.20170342s20150347.
Ping, Z., Zhihua, Z., Jihong, Y., Qingsheng, L., Zhiying, F., & Weixi, L. (2006). Application of NIR Technology in the Quality Detection for Foodstuff. Retrieved from http://en.cnki.com.cn/Article_en/CJFDTotal-XDYQ200601019.htm
Public Lab. (n.d.) Infragram. Retrieved from https://publiclab.org/wiki/infragram
Schaepman, M. E. (2009). Imaging Spectrometers. In The SAGE Handbook of Remote Sensing. Editors: Warner, T.A., Nellis, M. D., & Foody, G. M. Pages: 166–178. Retrieved from http://www.geo.uzh.ch/microsite/rsl-documents/research/publications/book-chapters/2009_Spectrometers_HandbookRS_MS-3188925952/2009_Spectrometers_HandbookRS_MS.pdf
Sparén, A & Svensson, O (2017). Transmission Raman: Methods and Applications. In Encyclopedia of Spectroscopy and Spectrometry (Third Edition). Editors: Lindon J.C., Tranter, G.E., & Koppenaal, D.W. Elsevier Ltd. ISBN 978-0-12-803224-4
Solar Radiation and Photosynethically Active Radiation. Fundamentals of Environmental Measurements. (2014, Mar 21). Retrieved from https://www.fondriest.com/environmental-measurements/parameters/weather/solar-radiation/
Tarver, E. (2021, August 2). Value Chain vs. Supply Chain: What’s the Difference? Retrieved from https://www.investopedia.com/ask/answers/043015/what-difference-between-value-chain-and-supply-chain.asp
Tsuchikawa, S., Ma, T. & Inagaki, T. (2022). Application of near-infrared spectroscopy to agriculture and forestry. ANAL. SCI. 38, 635–642. https://doi.org/10.1007/s44211-022-00106-6
Yeong, T. J., Pin Jern, K., Yao, L. K., Hannan, M. A., & Hoon, S. (2019). Applications of Photonics in Agriculture Sector: A Review. Molecules, 24(10), 2025. doi:10.3390/molecules24102025
Zhang, Hao, et al. (2011). Estimation of rice neck blasts severity using spectral reflectance based on BP-neural network. Acta physiologiae plantarum 33 (6): 2461-2466.
Related Products
- F-751 Grape Quality Meter
- Custom Model Building
- F-910 AccuStore
- F-751 Melon Quality Meter
- F-751 Kiwifruit Quality Meter
- F-750 Produce Quality Meter
- F-751 Avocado Quality Meter
- F-751 Mango Quality Meter
- F-900 Portable Ethylene Analyzer
- F-950 Three Gas Analyzer
- F-920 Check It! Gas Analyzer
- F-960 Ripen It! Gas Analyzer
- F-940 Store It! Gas Analyzer
Most Popular Articles
- Spectrophotometry in 2023
- NIR Applications in Agriculture – Everything…
- The Importance of Food Quality Testing
- The 5 Most Important Parameters in Produce Quality Control
- Melon Fruit: Quality, Production & Physiology
- Fruit Respiration Impact on Fruit Quality
- Guide to Fresh Fruit Quality Control
- Liquid Spectrophotometry & Food Industry Applications
- Ethylene (C2H4) – Ripening, Crops & Agriculture
- Understanding Chemometrics for NIR Spectroscopy