Liquid Spectrophotometry & Food Industry Applications

Scott Trimble
September 3, 2021 at 4:22 am | Updated April 11, 2022 at 6:44 am | 13 min read
Though spectrophotometry applications are used in industries for solids and gases, this technique was initially developed for liquid analysis. Liquid spectrophotometry is a non-destructive, rapid method of liquid analysis that can replace many cumbersome techniques. Liquid spectrophotometry is popular not only for food research, but throughout the food industry. An emphasis on quality and accountability requires a non-destructive, quick, and precise analysis method to get objective and comparable data to comply with accepted standards in global supply chains. Growing use of this technique can be additionally attributed to the availability of small, portable spectrophotometers, which have improved in recent years.
Understanding Spectrophotometry
Spectrophotometry measures absorbance, reflectance, and transmittance of light, just like spectroscopy. However, while spectroscopy measures the interaction of matter with different wavelengths, spectrophotometry measures the intensity of light in the wavelengths interacting with matter.
Spectrophotometry estimates the number of photons in the light spectrum, which is absorbed and transmitted by matter. The light spectra usually used in spectrophotometers are visible (400-700nm), ultra-violet (185-400nm), and infrared (760nm to 1mm). Both inorganic and organic compounds can be analyzed by spectrophotometry. In the food industry the following bands are ordinarily used:
- Ultraviolet (185 – 400 nm) and visible (400 – 700 nm) wavelengths to study biochemistry processes, since most biochemicals absorb light in the UV-visible range of light.
- Near-infrared (NIR) wavelengths that fall between 760-1400 nm are popular in the food industry since NIR reacts with the hydrogen bonds formed with carbon, oxygen, and nitrogen.
How a Liquid Spectrophotometer Works
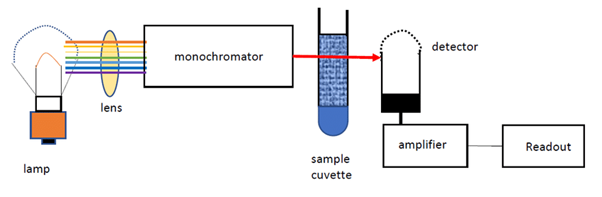
A spectrophotometer consists of two parts: one that produces light of a selected wavelength and a part that measures the light intensity of transmitted light. As Figure 1 shows, the liquid sample is placed in a cuvette between the light source and the photometer that measures light intensity.
Subscribe to the Felix instruments Weekly article series.
By submitting this form, you are consenting to receive marketing emails from: . You can revoke your consent to receive emails at any time by using the SafeUnsubscribe® link, found at the bottom of every email. Emails are serviced by Constant Contact
Figure 1: Principle of liquid spectrophotometry, Rahman et al. (2020). (Image credits: DOI:10.31479/jtek.v1i8.62)
Light from a source is focused by a lens system to create a parallel beam that is directed to a monochromatic grating, which acts as a prism and separates the white light into its component wavelengths. By rotating the monochromatic grating, it is possible to choose a wavelength that is then passed through an exit slit, which directs the light to the sample in a cuvette. The light passing through the cuvette is measured by a photometer, which sends an electrical signal to a galvanometer that displays the results.
The amount of light that is absorbed by a liquid depends on the concentration and type of compounds in it. Hence, it is necessary to know which light color or wavelength will be absorbed by the sample. For example, liquid spectrophotometry is used for estimating hemoglobin, which absorbs blue and green light, making blood look red. So, absorbance of green or blue light is used to determine the concentration of blood in a sample. The difference in intensity of wavelengths that are transmitted or are passed through the solution is used to identify the components and their concentrations.
In transparent and translucent liquids, transmission is used in spectrophotometry. Turbid liquids, which are opaque, need reflectance to analyze samples.
Requirements for Liquid Spectrophotometry
In liquid analysis, the sample has to be held in a cuvette/container and often requires a reagent. Light from the exit slit, while traveling through the sample, will also have to pass through the cuvette and the reagent. Light will react with these two associated materials and their influence must be accounted for, as they are not fixed parts of the device but are changed frequently.
Water: In liquid spectrophotometry, water is important, as it is commonly used as a reagent. Water is also used as a blank, standard, or in-sample treatment. If water purity is not ensured, the accuracy of the analysis will be compromised.
Impurities in water could be organic compounds, ions, particulates, or even microbes. The purity of water that can be used for liquid spectrophotometry is, therefore, regulated by strict requirements, especially for sensitive measurements. Purity is quantified by levels of compounds and electrical resistance.
Containers: The cuvettes used for liquid spectrophotometry must have a standard width, as this is the length of the light path through the sample. This is usually 10 millimeters. The shape and size of the cuvettes will differ, depending on the minimum sample that is to be used. Similarly, the containers can be made of plastic or glass. The material will depend on the instrument and the wavelengths selected. For example, UV light needs cuvettes made of quartz glass.
Properties Measured by Liquid Spectrophotometry
Liquid spectrophotometry is used to determine the following sample traits:
- Opacity
- Color
- Content
Opacity
By definition, opacity means the ability of a material to obstruct the transmission of light. At times, this can be interesting without delving deeper to find the compounds causing the opacity. The amount of light allowed to pass through depends on the concentration of the solute.
- In translucent liquids, such as apple juice, transmission can still be used to measure opacity.
- In completely opaque liquids, such as orange juice, reflectance is used.

Figure 2: A non-contact imaging spectrophotometer is used to test the color of foundation on a participant’s foundation-coated cheek, applied with a brush applicator, Yan et al. (2020). (Image credits: https://doi.org/10.1002/col.22584)
Color
Liquid spectrophotometers also measure color. This is used in scientific studies and industries for analyses of raw materials and finished products.
- Color is an important parameter that influences consumers’ preference in choice of food. Liquid spectrophotometers help in tracking the difference in lots and in maintaining a consistent color in output.
- Color is also used in quality control of industrial pigments and inks used in paints, textiles, etc.
- Companies test cosmetics, for example, by studying the color change in liquid foundation, as shown in Figure 2.
- Medical diagnosis uses the measurement of fluids like blood.
Color is also important in water quality or wastewater analysis. It can indicate the presence of microbes or pollutants like organic matter, oil, grease, industrial waste, or metals in water and wastewater.
- Nowadays, many accepted standards use color to quantify water and liquid quality, which are based on the color scale developed by chemist Allen Hazen in 1892. He used the Platinum-Cobalt scale that uses yellowness to detect contamination of drinking water and wastewater.
- The American Public Health Association (APHA) has a color scale that requires objective spectrophotometric measurements for water purity analysis, based on the Hazen color scale.
- Several industries also use the Hazen Color scale for quality analysis; for example, it is used in monitoring petroleum.
Content
Spectrophotometry can detect the structure of a chemical compound and can also detect microbes. This helps in content determination in liquids and has applications in the food industry, forensics, and water quality testing.
- Trace amounts of metals, like copper, have been detected using liquid spectrophotometers using very small samples.
- It is being used to find an increasing number of contaminants due to anthropogenic activity and farming methods, like pesticide persistence on fruits.
Comparison with Other Standard Methods
Of the traditional alternatives to liquid spectrophotometry, devices and methods to measure color and content are more abundant than opacity.
Color
In the following traditional methods, before spectrophotometry became an established practice, color in liquids were measured by comparing samples with a standard:
- Platinum-Cobalt (Pt-Co) method uses dilutions of chemicals of cobaltous chloride and potassium chloroplatinate dissolved in distilled water as a standard, with which the sample is compared.
- Calibrated glass slides were, and are still, common for comparing with liquid samples.
- Colorimeters are more sophisticated than the above two, but are simpler than spectrophotometers and compare the color with a standard. Colorimiters are often used in color quality control in the manufacturing process.
Liquid spectrophotometry is far more sophisticated and objective than even colorimeter measurement as it gives direct spectral data. It is, therefore, also suitable for research and product development.
Opacity
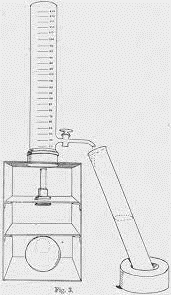
Figure 3: The opacity developed by Holker (1921). (Image credits: https://doi.org/10.1042/bj0150216)
A hundred years ago, a device called an opacimeter was developed by pathologist J. Holker to measure the opacity of liquids. It consisted of a long glass tube with a millimeter-scale etched on it, starting from the bottom at 20 to 250 at the top. At the bottom was a copper wire, which was placed over a light source.
When a turbid liquid was sampled, the wire was not visible from the top of the glass tube. Then, the tap was opened to lower the level of liquid in the glass tube. The millimeter reading, when the copper wire was again visible, was noted as the opacity expressed as 1/20 to 1/250 or 500x 10-4 to 40x 10-4.
Content
Finding compounds, metals, or elements in a liquid usually requires complicated chemical experiments and assays in laboratories. The methods vary depending on the compound being tested, and the range is too vast to cover here. Microbes, on the other hand, require investigation through microscopes.
A single liquid spectrophotometer could identify many such compounds and microbes if the wavelengths it reacts with are known. All of these traditional methods are tedious, time-consuming, and require skilled staff.
Food Industry Applications
Liquid spectrophotometry offers non-destructive, rapid, and precise analysis in real-time, making it suitable for repetitive and large-scale quantitative and qualitative analysis that is necessary these days in the food industry. Liquid spectrophotometry applications in the food industry use the technique to do the following:
- Analyze content
- Detect opacity
- Measure color
The main liquid spectrophotometry applications are for
- quality control,
- monitoring alcoholic and non-alcoholic beverage processing,
- and detecting contaminants and adulterants.
1. Quality Control
Controlling quality by liquid spectrophotometry uses all three properties of the technique and is replacing more complex analysis techniques, such as mass spectrometry and liquid and gas chromatography.
Content Analysis
Liquid spectrophotometry is used to analyze the content of drinks and oils for quality control by ensuring the following:
- Use of Permitted Ingredients: Many drinks are made of artificial concentrates and additives to achieve the right flavor or preserve the product. There is a move to reduce the amount and number of synthetic compounds used due to health concerns. Consequently, the materials that can be added to drinks are strictly regulated, and each country has different rules about composition, ingredients, and labeling requirements.
- Ingredients Concentrations: The ratio of ingredients to water is fixed for many drinks, as is the permissible levels of pulp. For example, conventional soft drinks have 90% water, while diet soft drinks can have 99% water. Sugar content is between 1 and 12% in soft drinks and must be correctly labeled due to health regulations concerning excessive sugar consumption. This is a parameter that is checked during quality control by government agencies around the world.
- Levels of Nutraceuticals: Many juices and drinks are sought after because they are a rich source of nutrients, vitamins, fiber, and antioxidants like anthocyanins. As such, there is a growing interest in the neutraceutical makeup of these products. Probiotic milk products, on the other hand, are attractive due to the presence of beneficial microbes like Lactobacillus spp, whose numbers can fall due to pasteurization, so these products also require standardization.
- Flavor: Certain compounds and their combinations produce flavor. It is possible to improve or identify taste based on the concentrations of these compounds. For example, the use of spectrophotometers is one of the methods scientists propose to measure concentrations of theaflavins and thearubigins for quality control in complement to tea tasting. Theaflavins make tea astringent, while thearubigins are responsible for the ashy taste.
- Grading of Products: Various grades of olive oils are differentiated by the amount of monounsaturated oils they contain. This difference can be detected by the higher absorbance of UV-Vis by extra virgin oil than pure olive oils, measured by spectrophotometry. It is also possible to differentiate between different varieties of wine, based on their composition.
Opacity Detection
Many fruit juices on the market are made by mixing concentrates with water. Using opacity, it is possible to judge if the drink has the correct and stated concentration of fruit juice. This quality control is carried out not only by producers, but also by suppliers and retailers.
Measuring Color
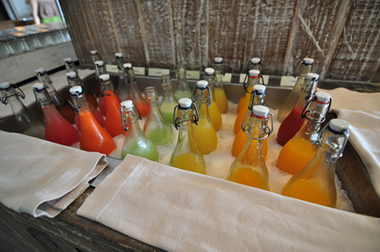
Figure 4: Fruit juice color matters, Brunei, Pixabay. (Image credits: https://pixabay.com/photos/juice-water-drink-fruit-fresh-1228276/)
Color is a crucial parameter not only for fresh produce, but also for processed products to establish the following:
- Identity: Color is the first quality parameter that is used to judge a product. People use color to identify the flavor or fruit it is derived from. Matching a drink’s color to its flavoris important, as even a difference in hue can affect consumers’ perception of the product. People have a hard time identifying flavors, even after tasting, if the drink does not have the expected color.
- Acceptability: If the color does not match the flavor, consumers will rate the product negatively and not accept it. Moreover, people tend to associate vibrant colors with more flavor, but too much color can also turn consumers away. Food color has a special meaning and depends on age and culture, all of which producers must keep in mind. Usually, younger people are likely to rely more on color to rate the taste and flavor of drinks and to identify food.
Producers take pains to see that the color of their beverages remains desirable, so objective color measurement is important. The color of juices, milk, or other beverages has been difficult to measure objectively with traditional methods due to opacity, and this is where spectrophotometry is invaluable. Transparent and translucent liquids’ color is measured through light transmission, while opaque liquids’ color is analyzed through reflectance.
2. Monitoring Beverage Processing
Producers of non-alcoholic and alcoholic beverages use liquid spectrophotometers, analyzing production in real-time to finetune the process and as an objective means of quality control of the final product. Monitoring production by frequent and quick analysis helps to consistently achieve the proper mix of ingredients and maintain flavor. In wine and beer production, spectrophotometry can also save money and increase quality.
Getting the Ingredients Mix Right
Drinks are made in many ways. Some drinks, such as energy drinks, are made by mixing ingredients. Using spectrophotometry makes it possible to measure if the beverage has the correct combination during production to maintain consistency in the final product. In the case of energy drinks, it is necessary to monitor the concentrations of key ingredients, like caffeine.
Maintain Flavors
Where drinks are developed by mixing different fruit juices, spectrophotometric analysis shows the percentage of each kind of juice present in the mix, based on the difference in spectra, and helps in creating the selected flavor. Measuring color can also be used to perfect the flavor or color to meet consumer expectations or brand requirements.
Making Wine
Winemaking is a complex and intricate business. Even small wineries are investing in liquid spectrophotometers to produce quality wine, as the technology saves time by avoiding tedious laboratory analysis and waiting for results. Spectrophotometers are used to monitor and predict fermentation throughout the process. Tracking the products of fermentation, like L-malic acid, acetic acid, and residual reducing sugars, can help winemakers adjust the sensory attributes like aroma and mouthfeel. Similarly, quantifying phenols can enhance flavor, color, and mouthfeel perception.
Brewing Beer
Beer brewing relies on fermentation by yeast to convert cereal sugars into ethanol and CO2. Additional measurable compounds formed in the process give the beer its aroma, taste, and color. Color can be essential for beer, as each type or brand is associated with a certain color, and this must be maintained to prove quality.
3. Detecting Contaminants and Adulterants
Liquid spectrophotometry is used to detect fraud perpetrated by the following:
- Mixing with an Inferior Quality Product: Sadly, fraud on the wine market is widespread because it is lucrative. Wine of inferior quality is often mixed with costly wine, and it can be difficult to detect visually. A precise measurement of the composition and color can, however, identify the difference in quality to detect possible fraud. It is also possible to determine whether the wine has all the sensory properties the labels promise.
- Using Adulterants: Another product also prone to fraud is olive oil. It can be mixed with cheaper canola, soybean, or palm oil and will affect the taste and nutritional value.
The quality of liquids can also be affected due to the presence of unwanted chemicals that enter the product due to the cultivation of the fresh produce or external pollution: - Pesticides: Conventional farming methods rely heavily on chemicals to control pests and diseases on the plant and fruit. Based on the time of spraying and the chemicals used, some pesticide residues may persist on fruits and, during processing, find their way into drinks. Tea leaves can also carry heavy loads of chemicals.
Detection of these pesticides is necessary for health reasons and to prevent tainted produce from being fraudulently passed as organically grown. For example, a spectrophotometric method to identify the fungicide carbendazim residues in orange juice has been developed in Senegal. - Pollutants: Pollutants can enter the food system through air, water, or land during farming, storage, or transport. The presence of such pollutant metals, even in ultra-trace amounts, can be detected in liquids and water or even liquid extracts of solid foods.
Expanding Use & Benefits for the Food Industry
A single spectrophotometer that analyzes a range of compounds is an investment worth making, and each test works out to be cost-effective. Moreover, the degree of accuracy and depth of knowledge it provides, which is necessary for research and product development, is not possible from most traditional methods. Since liquid spectrophotometers come in a range of sizes and types, their use is no longer confined to laboratories; instead, they have vital applications in many industries, and with modern advancements, can increasingly be operated by laypersons with little technical training.
—
Vijayalaxmi Kinhal
Science Writer, CID Bio-Science
Ph.D. Ecology and Environmental Science, B.Sc Agriculture
Sources
Akuli, A., Pal, A., Bej, G., Dey, T., Ghosh, A., Tudu, B., Bhattarcharyya, N., & Bandyopadhyay, R. (2016). A machine vision system for estimation of theaflavins and thearubigins in orthodoxy black tea. International Journal of Smart Sensing and Intelligent System. ISSN 1178-5608
Aleixandre-Tudo, J. L., & du Toit, W. (2018). The Role of UV-Visible Spectroscopy for Phenolic Compounds Quantification in Winemaking. Eds Solís-Oviedo, R. L., & Pech-Canul, A. C.Frontiers and New Trends in the Science of Fermented Food and Beverages.DOI: 10.5772/intechopen.79550enolic Compounds Quantification in Winemaking.
Bodian, E. H. T., Sarr, I., Sambou, S., Mendy, A., et al. (2017). Spectrophotometric Method for the Determination of Carbendazim in Orange Juice Samples Marketed in Senegal. Chemical Science International Journal, 21(1), 1-7. DOI:10.9734/CSJI/2017/37770
DuBose, C.N. (1980) Effects of colorants and flavorants on identification, perceived flavor intensity, and hedonic quality of fruit-flavored beverages and cake. Journal of Food Science, 45,1393-1399, 1415.
Does the COLOR of Foods and Drinks Affect The Sense of Taste? (n.d.). https://faculty.washington.edu/chudler/coltaste.html
Dorota Kregiel, (2015).”Health Safety of Soft Drinks: Contents, Containers, and Microorganisms”, BioMed Research International, 2015, Article ID 128697, 15 pages, https://doi.org/10.1155/2015/128697
Oram, N. (1995). The influence of flavor and color on drink identification by children and adults. Dev. Psychobiology, 28, 239-46.
Morawski, R.Z. (2008). On Food, Spectrophotometry, and Measurement Data Processing. Keynote Lecture. 12th IMEKO TC1 & TC7 Joint Symposium on Man Science & Measurement, Annecy, France. Retrieved from https://www.imeko.org/publications/tc7-2008/IMEKO-TC1-TC7-2008-IKL-002.pdf
Mouw, T. (2021, February 4). Measuring the color of drinks, juices and other liquids. Retrieved from https://www.foodengineeringmag.com/articles/99317-measuring-the-color-of-drinks-juices-and-other-liquids
Philipsen, D.H. (1995). Consumer age affects response to sensory characteristics of a cherry flavored beverage. Journal of Food Science, 60, 364-368.
Roth, H.A., et al.,(1988). Psychological relationships between perceived sweetness and color in lemon- and lime-flavored drinks. Journal of Food Science, 53,1116-1119.
Spence, C. (2015). On the psychological impact of food colour. Flavour 4, 21. https://doi.org/10.1186/s13411-015-0031-3
Stillman, J. (1993). Color Influences Flavor Identification in Fruit-flavored Beverages. Journal of Food Science, 58(4), 810-812. https://doi.org/10.1111/j.1365-2621.1993.tb09364.x
Thesseling, F.A., Bircham, P.W., Mertens, S., Voordeckers, K., & Verstrepen, K.J. (2019). A Hands-On Guide to Brewing and Analyzing Beer in the Laboratory. Current Protocols in Microbiology, 54(1). https://doi.org/10.1002/cpmc.91
Holker J. (1921). Methods of Measuring the Opacity of Liquids. The Biochemical journal, 15 (2), 216–225. https://doi.org/10.1042/bj0150216
Hughes, V. K., Ellis, P. S., Burt, T., & Langlois, N. E. (2004). The practical application of reflectance spectrophotometry for the demonstration of haemoglobin and its degradation in bruises. Journal of clinical pathology, 57(4), 355–359.
Rahman, H., Arini, S.F., & Utomo, V. (2020). Tannins Extraction of Tea Leaves by Ultrasonic Method: Comparison with The Conventional Method. Jurnal Teknologi 8(1):84-95. DOI:10.31479/jtek.v1i8.62
Rojas, F.S., Ojeda, C., & Pavón, J. (2013). Spectrophotometry | Biochemical Applications.
Sánchez Rojas, F., & Bosch Ojeda, C. (2009). Recent development in derivative ultraviolet/visible absorption spectrophotometry: 2004-2008: a review. Analytica chimica acta, 635(1), 22–44. https://doi.org/10.1016/j.aca.2008.12.039
SCRIBD. (n.d.). 9.01 Water and Environment – Apha Hazen Platinum Cobalt Pt-Co Astm D 156. Retrieved from https://www.scribd.com/document/413857822/9-01 Water-and-Environmnet-Apha-Hazen-Platinum-Cobalt-Pt-co-Astm-d-156
SCRIBD. (n.d.) Principle of Spectrophotometry. Retrieved from https://www.scribd.com/doc/237717147/Principles-of-Spectrophotometry
Silvestre, C. I., Santos, J. L., Lima, J. L., & Zagatto, E. A. (2009). Liquid-liquid extraction in flow analysis: A critical review. Analytica chimica acta, 652(1-2), 54–65. https://doi.org/10.1016/j.aca.2009.05.042
Tipparat, P., Lapanantnoppakhun, S., Jakmunee, J., & Grudpan, K. (2001). Determination of ethanol in liquor by near-infrared spectrophotometry with flow injection.Talanta, 53, 1199–120
Wen, X., & Guo, Deng, Q., & Guo, J. (2011). Ionic liquid-based single drop microextraction of ultra-trace copper in food and water samples before spectrophotometric determination. Spectrochimica Acta Part A: Molecular and Biomolecular Spectroscopy, 79 (5),1941-1945. https://doi.org/10.1016/j.saa.2011.05.095
Related Products
- F-901 AccuRipe & AccuStore
- F-751 Melon Quality Meter
- F-751 Kiwifruit Quality Meter
- F-750 Produce Quality Meter
- F-751 Avocado Quality Meter
- F-751 Mango Quality Meter
- F-900 Portable Ethylene Analyzer
- F-950 Three Gas Analyzer
- F-920 Check It! Gas Analyzer
- F-960 Ripen It! Gas Analyzer
- F-940 Store It! Gas Analyzer
Most Popular Articles
- Spectrophotometry in 2023
- The Importance of Food Quality Testing
- NIR Applications in Agriculture – Everything…
- The 5 Most Important Parameters in Produce Quality Control
- Liquid Spectrophotometry & Food Industry Applications
- Ethylene (C2H4) – Ripening, Crops & Agriculture
- Melon Fruit: Quality, Production & Physiology
- Active Packaging: What it is and why it’s important
- Guide to Fresh Fruit Quality Control
- Understanding Chemometrics for NIR Spectroscopy


